
Today we'll take a look at some charts for Pelangio Exploration Inc. (disclosure--have formerly done some contract work for this company, currently have a long position). They are currently active in Ghana at two sites, and a little less active in northern Ontario.

I remember back in December and January hoping this was forming a cup with handle. But the handle keeps going down. Will it bottom soon?
A two dimensional phase space projection (no trajectory, only the data) is presented below. As for the similar charts for Detour Gold, I have used a four-day time-delay.
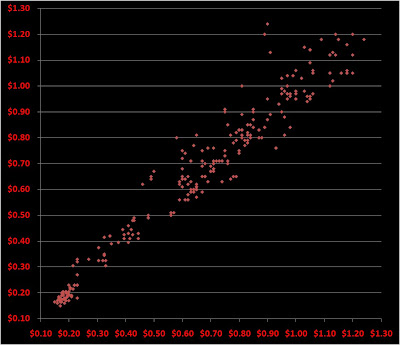
The data are dense enough to create a probability density graph using a box $0.05 on a side.
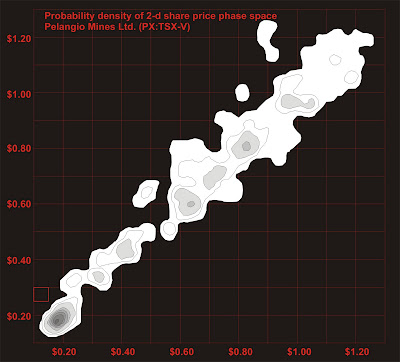
Contouring the probability density shows us that from our present price in the 50-55c range, a further fall will bring the price under the influence of the massive attractor in the 15-20c range. There are attractors in the 35c and 45c areas, but these are weak.
If the price can hold or rise slightly, it will remain under the influence of the attractors in the 60c to 80c range.
Drill, drill!
BTW, this is not investment advice. DYODD.
No comments:
Post a Comment