Dust flux, Vostok ice core

Dust flux, Vostok ice core
Two dimensional phase space reconstruction of dust flux from the Vostok core over the period 186-4 ka using the time derivative method. Dust flux on the x-axis, rate of change is on the y-axis. From Gipp (2001).

Friday, December 27, 2013

Faith

It is the Christmas season, and I feel like giving someone a lump of coal.

Among the paeans delivered in honour of Pope Francis last week, there was a quote attributed to Richard Dawkins, to the effect that the pope was dangerous because he was nice. "We don't want nice men in the Vatican." I don't know why anyone wouldn't like that. We should have nice people everywhere. But I digress.

Dawkins is famous as an atheist. Here is a sample quote:
I think the effect of all religious faith is negative . . . I think that faith teaches you  to believe something without evidence, and that shuts your mind off.
It certainly sounds like he thinks religious people are irrational. But he overlooks a couple of key points. The first point is that people are irrational--it's part of the human condition. The second is an idea that really seems to be endemic to the field of evolutionary biology.

(As an aside, here's how I heard this. More than 20 years ago, as a grad student, I helped organize a series of seminars on evolution. The speakers included a biologist, but we also arranged other speakers including an anthropologist and a philosopher--there may have been a mathematician as well, but I don't remember. The anthropologist gave (IMO) a real eye-opening lecture about cultural development amongst the primates. The evolutionary biologists were extremely huffy about it--animals, they said, do not have culture. They do not develop new behaviours, and then propogate them to other individuals. It is impossible. Their every behaviour is hard-wired into them and all expressed behaviours have a survival benefit, even if we can't figure out what it is.)

The evolutionary biologist's view of faith, considering that it is endemic to nearly all human cultures, must be that it confers an evolutionary benefit, even if we don't immediately know what it is. We can guess, however. Humans are social animals. We need to survive as part of a group--not many can wander off into the woods by themselves and make all the tools needed to survive in isolation. A shared religion is one way for a group to maintain cohesion, and so faith may enhance the survivability of the group.

Faith may help the individual as well. Faith may be a small flickering candle next to the sun of reason; and in today's world, it certainly seems that the sun of reason is forever in the ascendant. It was not always thus, and in the past there were times when we would find ourselves in spiritual darkness. Perhaps the plague burned through my village, leaving me the sole survivor. Perhaps you and a young cousin managed to flee into woods before the neighbouring tribe massacred yours. Faith then is the sputtering candle that allows us to continue on through the darkness--to give us the resilience to go on when otherwise we may not.

I would question Dr. Dawkins's motives. Why should he care if people behave irrationally? What makes it his business? I rather suspect Dr. Dawkins believes that by promoting atheism he is Improving the World. If so, I believe this to be a big mistake on Dr. Dawkins part. For instance, Messrs. Hitler, Stalin, and Mao were all attempting to Improve the World. Moreover, many of the inventions that really did improve the world were developed by people who were not trying to Improve the World, but merely trying to Improve their Own Lives, which turned out to be not only a good idea, but a lot safer for everybody else.

Instead of improving the world, I think you are much better off trying to improve your own life, as well as those of your friends and family. It limits the damage. It is easy to see other peoples' irrationalities; harder to see your own. Naturally, I do not suggest this to Dr. Dawkins. He is free to do as he wills, just as I am free to award him a lump of coal this Christmas season. Perhaps he can use it to warm his heart.

Tuesday, December 24, 2013

More commentary on NI 43-101 regulations

There have been a few discussions on NI 43-101 regulations at different sites the past couple of weeks.

I’m not as well-known as the other commentators on this topic—I probably don’t smell as nice either. But I’ll throw in my two cents.

The NI 43-101 reports fill a vital role in shareholder communication. That being said, there are some problems in that way that they are handled. My comments below are directed more at early-stage technical reports, not resource estimates.

A lot of weight is placed on the QP, and I think that the system should have more trust in them. Geology is not a precise science, and there are times when the QP could make a statement which may not be completely supported by hard data, but which represents an interpretation based on past experience in similar (and possibly even genetically related) projects. These sorts of judgement calls are frowned on under the current rules, but I think they may convey valuable information to the market, provided they are properly qualified. The guiding principle should be whether this is a reasonable inference to make based on the sum of available data and the knowledge of the QP. Remember, we are not talking about resource definition—we are answering the question, “Is it reasonable for a company to raise money on the market to invest in this property?”

For example, I wrote a technical report on a property in which there was a considerable amount of artisanal gold mining activity. The local villagers had carved a sluice 500 m long into the side of a mountain; then tore off the top of the mountain and sent it down the sluice into the river, where more sluices had been set up to further process the fines. The mountain was a greenschist, with the more resistant layers acting as the riffles. The river had been reduced to a sad stream choked by immense piles of detritus. I could see the same process underway at all the surrounding mountains. All of this work was being done by hand, so I inferred that it would be reasonable to spend a little money further exploring the property. The report was rejected—and one of the comments was that the artisanal mining operations were irrelevant, and I was to remove all mention of them from the report.

Irrelevant? It is probably the single most reliable indicator of gold on a property, next to digging a hole and pulling out a nugget. I could see it being considered irrelevant were I presenting a resource estimate, as I could not provide an adequate estimate of the volume of rock removed, and had no production figures for the operations. But in terms of addressing the question, “Is it reasonable to raise money on the public market to investigate this property?”, I felt that the operations were relevant.

I should add that the artisanal operations were not the only line of evidence I had—there were numerous soil geochemistry and geophysical surveys over the property, adits, and about 30 boreholes, all suggesting it would be reasonable to explore the property—some of these reports dated back over 60 years. But the artisanal mining operations were deemed irrelevant. This is the type of judgement in which the QP should not be second-guessed by a lawyer who has never left his desk in Toronto.

On the same project, the company ran into a problem with their spending requirements. They had supplied a list of expenses that totaled well over $100k, but someone at the OSC disallowed several items, leaving a total of a little over $98k. The report was rejected on the basis that the company had failed to spend at least $100k on the property. My first thought was to object over the arbitrary nature of disallowing some expenses, but as I thought more about it, I began to question the validity of having a fixed number at all.

I understand that the reason for having some sort of limit is to prevent me from staking my backyard, sending a dozen samples to the local lab (say, $600 in analyses) and then floating a company. But I think the decision as to whether the company has spent enough money should be made by the QP.

If you were lucky enough to get a nice property in Mexico that had been mined continuously from the days of the conquistadors until 1998, when it closed down due to low gold prices—and you proposed to investigate the mountains of tailings from 400+ years of operations—I daresay you could successfully answer the question “Is it reasonable to raise public money to explore the feasibility of this idea?” in the affirmative while spending a good deal less than $100k. At the same time, you could spend well over $100k on a singularly remote property in the Yukon and know little more than fuck-all about it. So this is another case where the honest judgement of the QP should be respected, and not second-guessed by a desk-jockey in Toronto.

To which I would add this, and I have already made the comment that the regs are not intended to protect the retail investor--they are there to provide benefit to: institutional investors at the expense of the retail investor; major consulting firms at the expense of the individual practitioner; and large companies at the expense of the juniors.

Why are you here on Christmas Eve?

Sunday, December 22, 2013

Tuesday, December 17, 2013

Sunday, December 15, 2013

Gold-USDX breaks down

Last time we looked at a chart showing the decline of both gold and the US dollar in tandem. Today we consider their product (that is, USDX x gold price) as a possible driving factor for the performance of gold equities. For a gold producer outside the US, this product reflects the value of its product.

And there are a surprising number number of countries in which the US dollar is not the official currency.

If, as is commonly thought, the US dollar and gold are inversely correlated, there will be no major change in this product through time. This chart shows us otherwise.


Gold-USDX rose from lows in late 2008 to gold's spike top of over $1800 in late 2011, remained consistently high until late 2012 then dropped off a cliff in April, bouncing off the bottom in July and October.

GDX, which I am using as a proxy for gold producers, rose in tandem with Gold-USDX from late 2008 until early 2011, slowly declined to late 2012 (when gold-USDX was stable), and fell quite sharply until the bounce in gold-USDX in mid 2013.

One note about the bounce--I'm not a big fan of simple TA, but will note that the level at which the bounces occurred is exactly 1000. And unfortunately, as of last week, the gold-USDX penetrated the 1000 level to the downside. Merry Christmas!

Thursday, December 12, 2013

Gold's decline is doubly painful

Once again we compare gold to the USDX for the last year, and we will see why the last seven months have been especially painful for gold investors. You might also consider its effect on the companies that mine the stuff.


We can divide the chart into roughly half at Mother's Day. Prior to Mother's Day, gold declined as the USDX rose, but since Mother's Day the trend has been for both to fall.

This second trend is doubly painful for gold holders. Not only are you getting fewer US dollars per ounce, but your US dollars are themselves losing value. This is precisely the opposite of what happened from late 2009 to mid 2010. Back in those halcyon days, it was a great thing to be long gold.


On the bright side, the gold/USDX state still lies along the advance line it took a couple of years ago that carried it to $1800+. On the down side, I still own some, so WTFDIK?

Tuesday, December 10, 2013

The rise of the virtual economy, part 2--retail consumption indicators

I recently received some publications from Dr. Ray Huffaker, who studies reconstructed phase space portraits from agricultural cycles. There are some interesting data sets presented in these papers which echo some of the themes I've argued in earlier postings.


The above figure shows retail beef consumption per capita. Data comes from the USDA, the figure is snipped from McCullough et al. (2012). Notice the large decline in the late 1970s. Perhaps you think that decline was due to changing preferences in meat--perhaps more Americans chose to eat pork instead.


Data and figure as above--notice there is also a decline in per capita pork consumption at the same time. Not as marked as the decline in beef, but still present.


Comparison of metal usage to global GDP. Chart from 
Handselbanken Capital Markets.

As posted before, something appears to have happened to the economy in the late 1970s, which puts the lie to the reported GDP growth figures. Would the government exaggerate these numbers? Perhaps to tell you that the economy is doing fine, and if you happen to be experiencing a drop in your standard of living, well, you just need to work harder. Or go buy something with no money down and no payments for three years.

One last figure. Perhaps the decline in beef consumption was due to the "cholesterol scare".


In this figure from McCullough et al. (2013), we see that the cholesterol scare happened after the major decline in beef consumption. Furthermore, the major declines in beef consumption both correlate to increases in the relative price of beef (the beef/chicken ratio on the right axis).

Some comments on previous articles suggested that the decline in copper and zinc production was due to replacement with plastics or aluminum. My counter to that was that copper cannot be replaced in most of its applications, and the decline in copper consumption speaks to a real decline in economic activity--one which was not reflected in reported GDP numbers. The simultaneous per-capita decline in beef and pork consumption supports this conclusion.

References:

McCullough, M. P., Huffaker, R., and Marsh, T. L., 2012. Endogenously determined cycles: Empirical evidence from livestock industries. Nonlinear Dynamics, Psychology, and Life Sciences, 16: 205-231.

McCullough, M. P., Marsh, T. L., and Huffaker, R., 2013. Reconstructing market reactions to consumption harms. Applied Economics Letters, 20: 173-179. doi: 10.1080/13504851.2012.687091.

Wednesday, December 4, 2013

There's no terror like state terror

. . . we study the frequency and severity of terrorist attacks since 1968. We show that these events are uniformly characterized by the phenomenon of scale invariance, i.e., the frequency scales as an inverse power of the severity, . . .
                                             Clauset et al., 2007 (pdf)

As we enter this season of peace, I find myself reflecting on war. And scale invariance.

The work cited above is old, and has been digested for some time. To recap, the frequency of terrorist events varies inversely as the square of the severity (typically measured in casualties)--and this relationship is independent of time selected, targets, weapon type, or responsible group. Even massive attacks, such as the September 11 attacks do not represent outliers, but form part of the statistical continuum of "normal" terrorism.


I've extended this graph to include a few other events.


In this chart, D represents recent estimates of the deaths during the Dresden firebombing, N1 represents deaths from the nuclear bombing at Nagasaki, T represents deaths during one particular firebombing raid of Tokyo, H represents deaths from the nuclear attack of Hiroshima, and N represents deaths during the massacre of Nanking.

We commonly carry out similar analyses for the purposes of risk assessments for natural hazards such as earthquakes. If we know the recurrence interval for small events, we can estimate the recurrence interval of very large events, provided the size-frequency distribution is characterized by scale invariance. We can carry out a similar assessment here. Unfortunately, we don't really know the recurrence interval of an event like the September 11 attack--but let us assume here that September 11 represents the largest terror attack one would expect in any 25-year period.

If so, then the recurrence interval for a Dresden would be 2500 years; for Nagasaki, it would be about 7500 years; for Tokyo, about 10,000 years, Hiroshima 15,000 years; and Nanking, about 50,000 years. I note that all of these events happened in the last century.

It seems likely that these state-sponsored events happen on their own frequency curve, which goes to show that nobody can do terror like the modern State.

Tuesday, November 26, 2013

NRH gold deposits follow-up - still lots more gold out there!

Once again the good folks at Natural Resource Holdings (this time teamed up with Visual Capitalist) have updated their report (pdf) listing gold deposits greater than one million ounces in size.

In earlier postings I discussed briefly the expectations for the size-distribution of gold deposits, using an earlier list published by NRH and historical Nevada as examples. My conclusion was that the size-distribution of gold deposits follows a scaling law over at least a couple of orders of magnitude. There is a maximum size for gold deposits, because hydrothermal cells can likely only be so large before they become unstable and divide into smaller cells, leading to gold of one (natural deposit) being scattered over several discrete (economic) deposits. So how do we count them?

There are minimum sizes for deposits as well, primarily for economic reasons. So our scaling law only seems to be valid over a pretty limited range.


The yellow line is a possible scaling law to describe the size-distribution of gold deposits. Interestingly, its slope is 1 (pink noise), a very common scaling law in physical systems. It is quite different from the slope of 1.5 obtained from Nevada deposits. I'm not sure how to explain this, except that the Nevada deposits are almost exclusively of one type, whereas the global deposits represent all known settings.

As before, I don't expect that we will find many more huge (> 35 M oz) deposits; but there is potential to fill in the gap below the line in the 1 M oz range. From the above graph, we would still expect to find at least 400 more deposits, mostly in the 1 - 3 M oz range.

In reality, the number will likely be higher, as the census would still not be complete. It would be foolish to assume there are no deposits in Antarctica, for instance, even if climate and politics makes their exploitation unlikely. There are also numerous deposits on the seafloor, even if it may be a long time before control systems reach the point where they can correctly distinguish between ore and waste material while more than a km underwater.

All of this suggests that the yellow line needs to be shifted upwards--which opens up the possibility of many more deposits in the >10 M oz category still to be found. No guarantee on costs of all these, sorry.

---
Almost forgot to h/t Otto - although I'm sure I would have noticed this eventually.

Saturday, November 23, 2013

Interpretation of scaling laws for US income

It has been remarked that if one tells an economist that inequality has increased, the doctrinaire response is "So what?"
                                          - Oxford Handbook of Inequality

h/t Bruce Krasting

Social Security online has published a full report on income distribution in America.

Two years ago we looked at the distribution of wealth in America. Today we are looking at income.


There were a total of about 153 million wage earners in the US in 2012, which is why the graph suddenly terminates there.

As we have discussed before, in self-organizing systems, we expect the observations, when plotted on logarithmic axes, to lie on a straight line. Casual observation of the above graph shows a slight curve, which gives us some room for interpretation.

I have drawn two possible "ideal states"--the yellow line and the green line. Those who feel the yellow line best represents the "correct" wealth distribution in the US would argue that the discrepancy at the lower income (below about $100k per year) represents government redistribution of wealth from the pockets of the ultra-rich to those less deserving. Followers of the green line would argue the opposite--that the ultra-wealthy are earning roughly double what they should be based on the earnings at the lower end.

Which is it? Looking at the graph you can't tell. But suppose we look at the numbers. Adherents of the yellow line would say that roughly 130 million people are getting more than they should. The largest amount is about 40%, so if we assume that on average these 130 million folks are drawing 20% more than they should (thanks to enslavement of  the ultra-wealthy), we find that these excess drawings total in excess of $1 trillion. Thanks Pluto!

The trouble with this analysis is that the combined earnings of the ultra-wealthy--the top 100,000--earned a total of about $400 billion. They simply aren't rich enough to have provided the middle class with all that money.

Now let's consider the green line. Here we are suggesting that the ultra-wealthy are earning about twice as much as they should be, and let's hypothesize that this extra income is somehow transferred from the middle and lower classes.

As above, the total income of the ultra-rich is about $400 billion. If half of this has been skimmed from the aforementioned 130 million, they would each have to contribute about $1500.

I expect a heavier weight has fallen on those at the upper end of the middle-class spectrum; but even so, $1500 per wage earner does seem doable. Of the two interpretations, the green line looks to be at least plausible, and we are forced to conclude that those who believe the ultra-wealthy are drawing a good portion of their salaries from everyone else have a point.

But isn't $1500 per year a small price to pay to create a really wealthy super-class?

Paper on causes of income inequality full of economic axiomatic gibberish here (pdf).

Thursday, November 21, 2013

The Classification Problem

Posting has been light as I have been gobsmacked by something I discovered in a book that I've had for almost twenty years. I've always had trouble understanding it. I'm a geologist, and find this sort of thing (pdf) challenging.

It has to do with these probability density plots I've been making in phase space. I developed the idea intuitively, but the publishing has always been a slog because I had difficulty presenting a theoretical justification of my approach. I had made a leap of faith that each area of high probability density in phase space was centred about an attractor of indeterminate type.

It was a bit of a fluke getting the paper published in Paleoceanography--the reviewers weren't sure they agreed with it but were willing to give it a go. In terms of number of citations it ranks among the least influential publications in the journal's history.

The discovery was an interpretation of Zeeman's classification problem. His idea was that given a system which is described by a vector field on a manifold (say, a 2-d plane, which is what I have been using, but any surface is possible) so that the trajectory of the time-evolution of the system indicates a flow along the vectors; and given the system is somewhat noisy, so that there is a small random component to evolution along the trajectory; then the end-state of probability densities from all possible initial states on the manifold will be an invariant property of the vector field. What you will end up with will be diffuse balls of higher probability around each of the attractors on the manifold in phase space.

I read this as a justification of my intuitive approach, and he's a real mathematician.

Edit: Reference

Zeeman, E. C., 1988. Stability of dynamical systems. Nonlinearity, 1: 115. doi.org/10.1088/0951-7715/1/1/005

Saturday, November 16, 2013

Ode to Janet Yellen

The only problem with this song is that it should have been written in 1913.


Wednesday, November 13, 2013

Complexity, bifurcations, catastrophe

What makes a system complex?

It is a perplexing problem--both its description and its quantification. One might think that the description of a system as complex would suggest it has many subsystems each acting in accordance with its own rules, and interacting with each of the other subsystems in ways that we find difficult to describe. But there are systems involving very few "parts" which exhibit the kind of behaviour we call complex.

Another possible definition may stem from the notion of the compressibility of the system's information. Is it difficult to describe the sequential outputs in a manner that is simpler than merely listing all of our observations? A good random number generator would exhibit such behaviour, but we would not describe that as complex.

John Casti has proposed that the complexity of a system is at least partially dependent on the observer. He uses an example of a rock lying on the ground. To the layperson, there are only a limited number of ways to interact with the rock (kicking it, breaking it, throwing it, etc.) . To a trained geologist, there are more (as before, as well as mass-spectral geochem, x-radiography, electron probe, etc.). So the rock seems more complex to the geologist, but that additional complexity actually stems from the observer.

Another example can be share prices, where the complexity depends on the timing of your observations. If you look at the price of, say, Anadarko Petroleum over the past year, using closing prices only. (for disclosure--no position).


Then we can look at one-minute increments on a daily chart (Nov. 6, 2013).


Note that the variability within the two charts doesn't seem all that different despite the changes of scale. Lastly we could look at how trading in Anadarko looks over one second. One particular second, that is, between 3:59:59 and 4:00:00 on May 17 of this year.


You probably wouldn't expect a lot of change over 1 s, but in this case you would be wrong: the price fell from about $90 to $0.01 in less than 50 ms. That's a loss of $1 billion in market capitalization per millisecond--keep losing money at that rate and before long you're talking real money!

This all seems to trigger a philosophical debate--is the complexity present when none of the observers are capable of seeing it? In the case of Anadarko, if you were a pension fund, your losses would have been real (although the trades were all cancelled and reversed after market close).

If the complexity of a system arises from within, then what characteristics do we ascribe to complexity. One characteristic is discontinuous behaviour, particularly when the inputs to the system are continuous. For instance, tectonic processes gradually cause stresses to accumulate in an area in a fairly uniform fashion, until a critical threshold is reached and the earthquake occurs.

The branch of mathematics that investigates the sudden onset of convulsions wrought by a slow change is called catastrophe theory. Catastrophe theory is generally considered to be a branch of bifurcation theory. By bifurcation we normally mean some change in the operations of a complex system. It could represent a transition from one stable state to another. It could also represent the development of new areas of stability in phase space (or their disappearance) or simply a change in the nature of a chaotic attractor.

In particular, sometimes the sudden appearance of a new mode of stability is brought about by the changing value of a slowly migrating parameter past a critical threshold. Such behaviour is called a catastrophe, in the mathematical sense.

In the past few years we have seen a major change in the mode of operations in the markets. In particular, the rapid growth of high-frequency trading has added complexity at timescales where such behaviour did not previously exist. This is another example of a catastrophe.

Tuesday, November 12, 2013

Sorry

Just a quick post to prove I'm not dead. Although if I have been replaced by someone who knows my password, how could anyone be sure?

Last night at dinner, my wife had to send back the desserts. Suddenly she got paranoid. "Remember that time we went to Stratford and I sent back my meal because it was too salty, and we had a long discussion with the chef and he gave me a complementary meal, but all the remainder of the day I was sick with diarrhea? I'm sure he put laxatives in the food. I hope they don't do that here," and I said, "I wouldn't worry about. Laxatives aren't the oriental way. They're more into heavy metal toxicity. Russians and Israelis are partial to polonium-210." Then my son asks, "What do Canadians do?" I said they apologize a lot.

It isn't well known, but if you apologize enough to someone, they will die.

Sorry.
Sorry.
Sorry.
Sorry.


Saturday, November 9, 2013

Junior gold explorers have a structural problem

Exploration geologists spend a lot of their time looking for gold, but probably not much time thinking about it. Admittedly, my sample size is pretty small. I did ask a couple of colleagues why they thought we spent so much time looking for gold, when it was pretty clear that things like copper, zinc, and nickel are more socially useful.

I also never used to think about it, other than the pithy advice I received from an old employer long ago. "I like gold," he said, "because you can always sell it." There isn't the same market risk in gold that there is in iron--you can find a big iron deposit, but there may not be the demand required to justify bringing it into production.

I accepted that the twin notions of gold as money and it being the lowest risk metal to market (but not the lowest-risk metal to find!) were the reason that exploration for gold typically consumes about 50% of the global budget for non-fuel mineral exploration. The same was true for 2012, according to the Exploration Review published in May of this year (log-in required).

Mining Engineering only carries information back to 1996, but over that time gold exploration has dominated all other (non-fuel) mineral exploration. With so much being spent on gold exploration, it's no surprise that there are so many junior gold exploration companies. The question that concerns me now is whether or not this is the normal state for exploration.

As it has been this way for nearly 20 years, one might think that this must represent the normal state. But there has been a growing instability in our economic system for a longer period than this, and this emphasis on gold exploration may be a function of our distorted economy.

As evidence, I submit the following exhibit.


Source (my annotation).

Looking at this chart, the dominance of gold exploration came into effect as a consequence of the rising gold price into 1980; which itself was a consequence of Nixon removing the US dollar from the gold standard. But for the previous 30 years, gold exploration constituted less than 20% of total mineral exploration.

Part of this is logical. Gold rising from $35 to $800 would have attracted a lot of hot money into the sector. Part of this may also be a symptom of financialization of the economy that may have begun in the 1970s.

There has been a lot of commentary of how this cycle we have spent so much money only to discover so little. Part of the reason for our failures to discover is due to the change in the junior business model, which is a reflection of the fact that a single hole no longer creates the kind of pop in a stock that can feed management. Consequently, junior companies have had to fund salaries as well as resource definition through share immensely dilutive share issuances. Added to this is the difficulty of discovering a gold deposit (especially in a world of elevated political risk)--the risk of exploration itself combined with the risk of expropriation or suddenly increased royalties has made the discovery of an economic gold deposit a rare event indeed.

Clearly the emphasis on gold exploration is anomalous. An anomalously large amount of money being invested in one sector--more than is capable of providing an economic return--is the definition of a bubble. It is painful for me to admit this, as I work in the sector. If we allow ourselves to consider this possibility, we may also recognize the justifying statement--"you can always sell gold"--is equivalent to "house prices always go up" or "just buy the nifty fifty".

Just because a bubble has lasted a long time doesn't mean it will last forever. And just because it deflates from 10x normal to only 5x normal doesn't mean that we have experienced all the pain we will ever experience in the sector. We may have to consider that the current pain we are experiencing in the exploration industry is just the beginning of a return to reality. There could be much more pain to come as 80% of junior gold explorecos disappear.

I don't know what juniors are going to do. They can't really go into base metal exploration, at least not under the current financing regime, as they have no credible ability to raise the large amounts of capital to develop their deposits. It may be that the only way for them to survive will be as wholly- or partly-owned subsidiaries of major mining companies.

Eventually sanity will have to return to the economic system--the financialization will be reversed and goods will be manufactured in the developed countries--and the exploration budgets will favour base metals over gold. 

Tuesday, November 5, 2013

Happy anniversary chaos!

Fifty years ago, Edward Lorenz published the first paper (pdf) generally recognized to discuss chaos.

Lorenz didn't call what he had discovered 'chaos'. It's not clear that he really understood the importance of what he had discovered. He knew it was interesting, and when scientists find something interesting they publish it, and worry about the ramifications later.

What Lorenz had discovered is that a deterministic system could have unpredictability. It is difficult to convey how unexpected this discovery was at the time, because the idea of what is now called chaos has disseminated (although imperfectly) through our common culture. A deterministic system is one in which the rules are well described (via equations) which operate on data to produce results. Since the time of Laplace's Dr. Manhattan quote, it had always been assumed that nothing unexpected could arise from such a system when an initial position and the rules of motion were defined to arbitrary precision. Unexpected behaviour should only result from randomness.

So when Lorenz put together a simple model for atmospheric convection in the presence of heating, he used three simple differential equations, simple boundary conditions, and an arbitrary starting point, there would have been no reason to suspect that anything unexpected might occur. After all, all the parameters in the equations were known.

In essence, what he discovered was that minute variances in starting conditions led to extremely large variations in outcome. This again was unexpected, because our knowledge was largely built on assumptions of linear behaviour, in which small variations only grow larger slowly. Lorenz's interpretation of what he had discovered was to correctly point out that long-term weather forecasting was impossible, because it was impossible to measure the present state of the system with perfect accuracy--and the range of possible differing outcomes from the measurement accuracy was essentially the range of all possible weather.

The discovery and formalization of chaos theory led to entirely new fields of study encompassing different aspects of nonlinear dynamics and complex systems. Among them is one field of endeavour which has been a point of interest on this blog--complexity.

What do we mean by complexity? Actually, I'll write about this in a future posting. For now, let's just note the relative unpredictability of complex systems and get into the whys of it all later.

- - - - - - -

This post is a bit belated, because Lorenz's publication was actually in March. But something as momentous as chaos should celebrate over the course of an entire year.

Sometimes we go all out and celebrate something over a couple of years. International Geophysical Year (1957-58) and International Heliophysical Year (2007-08) come to mind.

There have already been numerous celebratory events so far this year. But first, a word about the enablers of this year's celebrations on the markets.

High-frequency trading spams the exchanges with empty quotes destined to be cancelled--so much that it appears that many legitimate offers do not get filled at optimum pricing, as the system becomes overwhelmed with meaningless numbers.

According to the exchanges, HFT is a good thing. It increases liquidity, or at least that is the axiom that guides their acceptance. Unfortunately, observation tells us that the opposite may be the case--that HFT causes liquidity to vanish precisely at the time it is most needed.

In the last 50 years, we entered the nonlinear world. But our thinking--especially institutional thinking--is still trapped in the linear world.

In the linear world, if something is a benefit, then more of it is a greater a benefit. But in the nonlinear world, where one may be a benefit, and two may be better; three could turn out to be horrifying.

So in celebrating 50 years of chaos, the exchanges (with their sponsors, the algos) have brought you the following celebratory events.

Flash crash on the German market. Twitter feed flash crash. (Appropriately enough, both of these were in April). Thee Anadarko flash crash. Information travels faster than the speed of light! Closing of the Nasdaq options bourse. Not to mention hundreds of strange trade executions across all the exchanges.


How to lose lots of money in 45 ms by Nanex.

Most of these problems are the (un)predictable result of the interaction of numerous algorithms. Some may have been errors, or the so-called 'fat finger' trades; others may have been other form of human or algo error.

Algo error. Was that supposed to happen?

The markets are not what they used to be. The overall superstate has changed over the last ten years from one dominated by humans to one dominated by machines. The result has a been a series of entirely new phenomena, which we have earlier termed 'innovation'.

The year isn't over yet. I look forward to the next special event. I don't think I have long to wait.

- - - - - - - - - - - - - -

And then there's this. I was going to put in something by King Crimson here, but this seemed more appropriate.

Wednesday, October 30, 2013

Monday, October 28, 2013

This chart is meaningless

I am very sorry to be picking on this article, but others have been saying much the same thing so this may be worth a brief mention.


(I did look around sharelynx a bit, but didn't find it).

The contention is that the creation of new debt in the past couple of years must bring about an increase in the gold price. This conclusion is supported by an illusion which is fostered by the purely arbitrary choice of a scale for the gold price. Unfortunately I am too lazy to go and put the data for these time series together so you will have to follow along with the plots I have below.

We compare the production of bedknobs from broomsticks with the production of broomsticks from bedknobs.


From this graph, we can see that bedknob and broomstick production grew more-or-less in tandem, until recently, when bedknob production suddenly fell. You would use this graph to support your prediction of an increase in bedknob production.


Same data, but with a slightly different scaling for bedknob production. You could use this graph to support your contention that there was a bit of a blow-off top in bedknob production in the recent past, but it is now back in line with broomstick production, in which state you expect it to continue.


Same data, different scaling. Here, not only was there a recent blow-off top in bedknob production, but it is quite clear that bedknob production still has further to fall to come back into line with broomstick production.

You can do the same with the chart at top. Whatever story you want to push--gold to rise; gold to fall; gold to stay the same--all you have to do is change the scale accordingly. Hence the title of this post.

This graph is seductive because it does seem logical that increasing the creation of debt and money should increase the gold price. But we don't know what the correct relationship is, so have no real way of stating whether gold should rise, fall, or remain neutral from these data alone.

Friday, October 25, 2013

Darling, be home soon

I've been listening to this a lot lately, having just rediscovered my Lovin' Spoonful tape behind the desk. I had forgotten what a great song this is.


Wednesday, October 23, 2013

Economic policy and the price of gold

Then the rumour circulated that at night the Fed Governors neglected their sacrifices and prayers. A great depression seized everyone. One day the President said to the Fed Chief, "When will we celebrate the return of normal unemployment rates? I would like to make a journey and return in time for the feast. How long is it until the day of the feast?" The Fed Chief was embarrassed. It had been several days since she had looked at the moon and the stars. She had learned nothing more about their courses. The Fed Chief said, "Wait one more day and I will tell you." The President said, "Thank you. Tomorrow I will come to see you again."
The Fed Chief gathered the Fed Governors together and asked, "Which of you lately has observed the course of the stars?" None of Fed Governors answered, because they had all stayed to listen to the stories of Fiat-do-lar. The Fed Chief asked again, "Hasn't even one of you observed the course of the stars and the position of the moon?"
                                                 -- modified from The Ruin of Kasch

Economics isn't a science. It is a mistake to think it would be so. Science does not have schools. Only philosophies have schools.

The difference between a science and a philosophy is the difference between seeking truth while honestly admitting you don't know it and declaring that truth is something you define.

Ideally science is described by working hypotheses, which are constantly tested, and if falsified, replaced (unless pride is involved or money). In philosophy, you begin with axioms, which are untestable statements that are defined as being true. Each school of economics has its own set of axioms. From axioms, you apply rules of inference (logic) in order to generate new statements, which are also true. These generated statements are called theorems. Thus all theorems are true (within the school of philosophy) but not necessarily applicable to the real world!

In the early days of geology, there were competing schools: the Neptunists and the Plutonists being two that come to mind immediately. The Neptunists believed that all rocks formed in the sea, either as sediments, or by crystallization as salts (this was their central axiom). The Plutonists believed that all rocks formed from magma (as their central axiom). Debates between adherents of the two schools were rowdy, fruitless affairs, because the nature of philosophy is that it cannot be overturned by mere observations.

The distinction between science and philosophy with respect to economics is important because economists have an annoying ability to set policy--policy that affects the quality of your lives. It probably doesn't matter much to you whether some geologists can't decide among themselves whether a particular rock formed in the sea or on a volcano (or even on a volcano in the sea). But it does make a difference if some Fed official acts on her belief that bankrupting the elderly eliminating interest on savings is a cure for unemployment.

Application of economic policy follows the axiomatic approach. Some high priest of an obscure caste decides on a cure for economic woes. Perhaps he dances around like a medicine man. The evil spirits are expunged, so that unemployment levels will finally fall. Maybe.

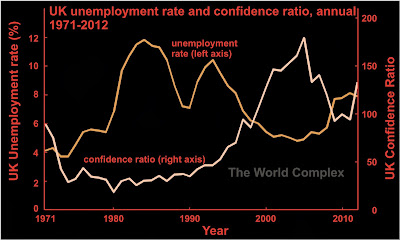
Recently, The World Complex presented the inverse correlation between the unemployment rate in the UK and its "confidence ratio" (dollar value of public debt divided by the dollar value of gold holdings). The idea was that a high ratio could only be supported if bondholders had high confidence that the debt would be properly serviced (forget about repayment). The flip side is that a high ratio could be interpreted as a measure of a country's ruin.

In the article I had suggested that government economists might cheer a decline in the price of gold.

So today, we look at the same relationship for the United States.


Once again we see a strong inverse relationship between confidence ratio and unemployment.

One of the goals set out for the Federal Reserve is to manage the unemployment rate. Looking at this chart, the answer is clear--to reduce unemployment, increase the confidence. Confidence (as defined above) can be increased in three ways: 1) raise debt, 2) sell gold, 3) lower the gold price.

Of course we all know that correlation does not imply causation. But it doesn't have to in order to impact on Fed policy. That's the beauty of politics--reality and truth don't really matter when there are elections to be won.

There was a comment that perhaps I have too much time on my hands. I'm not sure if the intent was to say that only someone with a lot of time on his hands would notice this relationship. The economists at the Fed have far more PhD's and time on their hands than does this corner of webspace. So I'm sure they have already seen this.

So the question becomes--even if no causation can be established, can it be used to set policy? And what policies will be followed?

Raising debt is the old standby--but as we see in the clarified chart below, it doesn't seem to be working anymore.


Since the 2001 peak (on September 10, perhaps?), the increasing debt has been more than compensated by the rising price of gold. Don't be fooled into thinking the US is sinking into solvency--it is creating debt faster than any time in history. But the price of gold has been rising faster still (although we shall see about 2013).

It appears that policy #2, the sale of gold, is politically untenable. Officially at least. Selling gold is for lesser countries. So that leaves option #3--hope the price of gold falls. Perhaps they do more than hope.

. . . at first the story of Fiat-do-lar was like hashish when it makes wakefulness happy. Then the story was like hashish when it makes dreams delirious. Toward morning, Fiat-do-lar raised his voice. As the Nile rises in the hearts of men, so his words swelled. To some, his words brought serenity; to others, they were as terrifying as the appearance of Azrael, the angel of death. Happiness filled the spirits of some, horror the hearts of others. The closer morning came, the mightier that voice grew and the more it resounded within the people. The hearts of men rose up against one another like clouds in the sky on a stormy night. Flashes of wrath met thunderbolts of fury. When the sun rose, the tale of Fiat-do-lar reached its end. Ineffable wonder filled the confused minds of the people. For when the living looked around, their gaze fell upon the Fed Chief and Governors. They were stretched out on the ground, dead.
                                        -- modified from The Ruin of Kasch 

Monday, October 21, 2013

Why we face ruin

A nice compendium of UK economic data has recently appeared (h/t NESS). You are encouraged to download data sets for your own nefarious purposes.

As an example, I have decided to plot UK unemployment rate against the measure of confidence I proposed on these pages a couple of years ago. To recap, the confidence ratio is the ratio of outstanding public debt (in dollars) to the dollar value of the country's gold holdings. I chose "confidence" as presumably this ratio can only be high for a country in which investors have great confidence. For those of a different mindset, it can be viewed as a measure of a country's ruin (although it would be better to include other foreign currency reserves).


UK unemployment data from the site mentioned above. UK debt came from google public data. UK gold holdings came from the data sets available from the World Gold Council. To find the dollar value of gold holdings, I used averaged annual prices available at Kitco. Average conversion rate of GBP to USD available here (although I don't remember where I got it for the original posting, which was up to 2011).

That is a good-looking example of negative correlation. It tells us that the unemployment falls when the confidence ratio is high. Now, there are three ways for a government to increase that confidence ratio:

1) increase debt
2) sell off gold
3) pray for the price of gold to fall (obviously in a non-manipulative manner that doesn't direct profits to favoured entities).

The fall in confidence that we observed in the latter half of the last decade was entirely due to the rising price of gold. Look at what that did to the unemployment rate! Clearly the fault of gold-bugs and conspiracy theorists. The rising price of gold completely overrode the excellent work of the British Parliament in driving up the country's debt. As for Gordon Brown, he was a hero! His only flaw was in not going far enough. If he had sold all the UK's gold, imagine how low unemployment would be today!

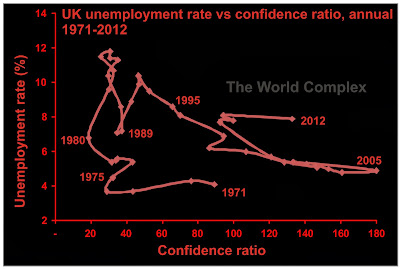
This wouldn't be a post on the World Complex if we didn't do some kind of state space portrait, so here it is: unemployment rate vs. confidence ratio.


Policy decisions of British Parliament and their impact on unemployment can be followed from the above chart. Clearly the government in the 1970s laboured under the delusion that reducing debts would benefit the economy(1). They were rewarded for their imprudence by spiking unemployment in the early 1980s.

By the mid-1990s, they had discovered the golden ticket. With the rising confidence ratio, the UK was rewarded with a falling unemployment rate. Then came Gordon Brown's heroics--by aggressively selling gold he caused the confidence ratio to rise and the UK was showered with new jobs!

There was a small crisis in the latter part of the last decade. But since then--clearly back on track. If the forward evolution of the system follows a similar catenary to the period 1993-2005, then a mere quadrupling of the confidence ratio will restore the unemployment rate to about 6%. The most prudent way to achieve this would be to immediately sell off 75% of Britain's remaining gold (2).

I find this approach to finances inspiring, and am willing to give it a try. Here at The World Complex, the unemployment rate is unusually high (technically I am welcome to go to the office, but the treasury is empty). Looking at my finances, I see the problem--I have very little debt and high savings (although much lower than they were two years ago, thanks to the ongoing turmoil in the junior mining market). To rectify this oversight, I will be issuing bonds. For reasons of fiscal prudence, I will try to keep my confidence ratio below 100, and will begin an auction for $25 million in debt next Thursday (3). No cheap google ad payouts here!

Notes:

(1) the rising price of gold may have had something to do with this. But this proves my point! Rising gold price = rising unemployment, you naughty gold bugs.

(2) in my opinion it would be too difficult to drive the gold price back down to $300/oz.

(3) securities officers and other sarcastically challenged individuals take note--this is intended as sarcasm. Your participation is welcome.

The World Complex attracts readers with taste

Potential advertisers take note.


The IP address was in Iran, so take that, Netanyahu!

I did verify that this site did come up as #1 on google searches using the given keywords, so I'm doing something right.


Saturday, October 19, 2013

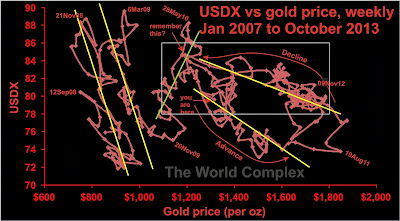
Gold vs USD, one year

Today we look at the relationship between gold and the US dollar.


The annotations refer to the gold price. An investor in US dollars would no doubt reverse the terms. And this is important because there are a lot more people invested in USDX than in gold.

The graph supports the supposed inverse relationship between the US dollar and gold.

Here is some context (updated from here).


The white pane is the area covered by the first graph.

Note that the price movements between gold and the dollar are not always inversely correlated--there is a six month period from November 2009 to May 2010 when the two moved in tandem, each increasing about 20% (which was actually a double-win for holders of gold). Perhaps a lot of people were taking Richard Russel's advice (50% USD, 50% gold).

Since May 2010, there has been one large advance and decline (in gold relative to the dollar). The advance and decline followed distinctly different trends. I would note that the current price point for gold and USDX is the same as near the beginning of the last large advance that carried us to just shy of $1900 (weekly closing).

Tuesday, October 15, 2013

A Soviet joke

Item: Walmart shelves stripped bare as limits temporarily dropped on EBT cards.

For us poor Canadians--EBT cards replaced food stamps as a means of providing food aid to the poor. It is like a gift card that gets charged up with a fixed amount automatically every week (or month). On the weekend a glitch in the system prevented retailers from reading the amounts left on the cards, and the majority of retailers refused to accept them. Some Walmart stores decided to honour the cards anyway, and a frenzy ensued.

It reminds me of an old joke told by the Russians.

A man who lived in Belomorsk had a rich American uncle, who died and left him a fortune. The State Apparatus dropped by to visit him in order to convince him he should donate his new wealth to the State. At length, the man agreed, but pressed for one concession--he would give the State his fortune if for one day all goods in all the stores in Belomorsk would be given away at no charge.

The local political bureau was reluctant to agree, but as the fortune was so vast and the stores so poorly stocked, they agreed. The announcement was made, and the next day immense crowds stormed the markets. People came from all the surrounding villages and even distant cities. The crowds surged through the stores, and within seconds the shelves were stripped bare. Fierce battles broke out everywhere over the scarce goods--it looked like Walmart during Black Friday. By noon the hospitals were filled to overflowing--and by evening, so were the morgues.

When at last the riot ended, the police descended on the man's house, demanding to know why he wanted such a terrible thing to occur. His answer: "Please, comrades--I only wanted to see what true Communism would be like!"


KSLA News 12 Shreveport, Louisiana News Weather

Friday, October 11, 2013

A song for junior exploreco longs


The mark of regulatory failure

It isn't news that the market for junior mining companies is bad.


And we all have our reasons for it--ranging from poor performance in commodities in general to extreme and horrifying fears of a general collapse in society into barbarism. But if the latter were imminent, wouldn't we expect to see everything else performing just as badly? The rest of the market isn't great, but it isn't as awful as the junior golds.

After the Bre-X affair (portions of the Bre-X files are here), regulatory officials created a set of regulations to guide technical reports. The goal was to make the type of fraud that Bre-X represented impossible.

Unfortunately, there are still types of fraud that go on in the markets, which are not affected by the regulations.

There are good companies run by competent management, with competent geologists and good properties. Sadly, these are in the minority. There are companies with well-meaning, but incompetent management or poor properties. These are more common. They raise money, spend it properly, but lose your money. Maybe you don't feel so bad because the guys were at least trying.

Then there are the criminals. There are lots of these. The current regulatory regime has eliminated some of them--the ones that manipulated their share prices by faking their sampling results by numerous methods which need not be elaborated here.

But the regulations have done nothing to eliminate the more insidious criminals which run companies purely for the benefit of raising money through share issuances and directing the proceeds to themselves either as salaries or as private billings. Arguably, the regulations have enhanced these companies, because they provide a checklist by which diligient, but criminal, management can maximize their credibility on the markets for a minimum of exploration expense.

If your plan is to raise a whole lot of money in order to pay yourself, the blessing of Canadian market regulators officials gives you the credibility you need to keep at it. Such companies can be called "lifestyle companies"--as they exist solely to maintain the lifestyle of their management.

How did it come to this? The regulations were designed to solve a different problem--one of criminal management expressing its criminality through manipulation or misreporting geological information (although see this). As for the lifestyle companies, as long as they satisfy the various listing requirements, the regulators have plausible deniability, and the exchanges can happily collect their fees.

A lot of money came into the junior mining sector since the advent of the new regulations. A lot of money. And there has been little exploration success to show for it.

The poor performance of the junior exploration sector is a crushing indictment of the regulatory regime in the Canadian markets. The retail investor has judged the NI 43-101 regulations and they have been found wanting.

Sunday, October 6, 2013

Syria and the decline

This certainly feels different from previous run-ups to war.

I don't know what's going to happen any more than you do. Certainly I am gratified to see that there is no immediate attack, but we still have miles to go.

The biggest difference I see between now and ten years ago is the immense skepticism the American people are showing towards possible action in Syria. Even the comments in the Washington Post are far more anti-war than I've ever seen them (also very anti-Kristol and anti-Krauthammer). Yes, there are still comments in favour of war--but they are a notable minority.

It is depressing to see our foreign minister express that Syria should not be given time to comply with the demand to hand over control of its chemical weapons to the international community. It's as if the Harper government wants to see an attack go ahead, even as they have not appetite to join in.

All of this gives me more hope than I've had these last few years.

- - - - - - - - -

Internet at casa Mickeyman will go dark for a few days as we've exceeded our bandwidth. I'll be in the local hotspot intermittently this next while.

Friday, October 4, 2013

Should Canada and the US merge . . . (updated)

. . . like Diane Francis asks?

No.

Sure, I could use the money. But I think in her calculations she has neglected to consider the extra costs to Canadians, like having to roughly double our per capita medical expenditures. Not to mention we might have to start pulling our weight in military adventurism around the globe. We might have to close our embassy in Cuba.

There's an old song I remember hearing from way back. The words used to be on the internet years ago, but I can't find them now. Unfortunately, on my copy the first line is garbled, so I'm not sure of the wording.

There's a fine country called America don't you know,
Just take a look at your atlas, it's the one that's down below.
There's fifty states in the union and something should be done,
To forget the war of 1812 and make it fifty-one.

There'll be colour television,
Social security,
Racial segregation and the Birch Society;
You can take the fifth amendment,
You can vote for LBJ,
You can even burn your draft card when we're Canada, USA.

Now some folks think we're English, which isn't true at all;
And some t'ink we're a colony that's run by Charles de Gaulle;
But we're looking up to greater things upon the glorious day,
When the capitol of our little state is Ottawa, CA.

There'll be colour television,
Social security,
Racial segregation and the Birch Society;
You can cheer for Jimmy Hoffa,
You can join the Klan today;
You can even be a Commie when we're Canada USA.

There's a bunch of stripes and fifty stars upon the Yankee flag,
There's gonna have to be fifty one when Canada's in the bag,
But when we see the flag unfurl, we'll know we've won the fight,
We'll be just before Connecticut in the third row from the right.

There'll be colour television,
Social security,
Racial segregation and the Birch Society;
You can take the fifth amendment,
You can vote for LBJ,
You can even burn your draft card when we're Canada, USA.

We'll all be much more affluent in the Great Society,
Their buck is worth $1.10 in Canadian currency,
The economy's going to get a boost for it's very evident,
That it costs us more to feed a Queen than pay a President.

There'll be colour television,
Social security,
Racial segregation and the Birch Society;
You can cheer for Jimmy Hoffa,
You can join the Klan today;
You can even be a Commie when we're Canada USA.

There'll be no more selling prairie wheat to all the commie crew,
There'll be no more Cuban sugar--that's very naughty too,
But think of all the benefits that surely have to come
When we're citizens of a country that's got the atom bomb!

There'll be colour television,
Social security,
Racial segregation and the Birch Society;
You can take the fifth amendment,
You can vote for LBJ,
You can even burn your draft card when we're Canada, USA.

Update: Just need to update that last chorus a bit:

There'll be welfare cheques and foodstamps,
Homeland Security,
The NSA on Google
And the end of privacy,
You can take the fifth amendment,
Get Obamacare today,
You can even shoot Iraqis when we're Canada, USA!

One more time--the distinction between human- and algo-trading

The markets do not act like they once did. The trading in certain stocks is operating on time-scales so small that they cannot be in response to human thought. Not only are certain individuals able to access key information before others and so respond to news releases faster than the speed of light, but certain entities have free range to post and cancel orders on a microsecond basis, and queue-jump by shaving off (or adding on) tiny fractions of a penny from their orders.

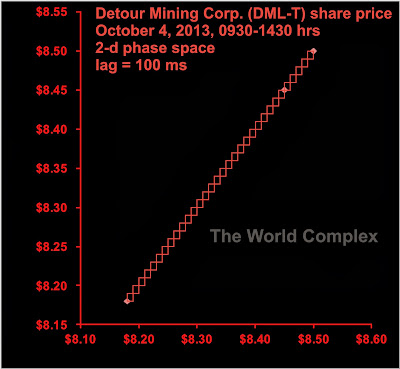
Stocks traded by humans tend to make significant moves on a timescale of minutes to days. Even when there is a news event that radically changes the apparent value of a company, if there are only humans in the market, the move takes time to occur. Below we a couple of charts for Detour Gold (I currently have no position in this stock)


Normally, when looked at on a ms timescale, the graph is not really distinguishable from a straight line.


The little squares occur because all the price-changes I saw in the course of the day were a penny. On this scale it scarcely matters which axis is the current price and which is the lagged-price.

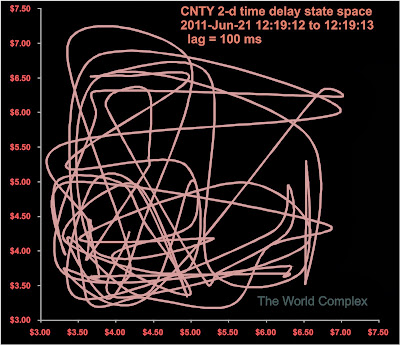
Once the algos get involved, the millisecond phase space plots get a lot more interesting. Some of them are works of art! Below, some plots for Century Casinos (I have no position in this one, either). Data here.


Algos playing tug-o-war.

Nice to look at, but maybe not so nice to trade against.

Remember the adage about playing poker: If you don't know who the sucker is . . .

Tuesday, October 1, 2013

Arctic sea ice in phase space

Another September has passed, and with it the annual minimum extent of Arctic sea ice. This year we saw a minimum of 5.1 million sq km, which is quite a bit more than the minimum of last year.


As noted before, there is a distinct break just after 1995.


I still haven't seen anything that would lead me to reject the possibility that we are tracing out a new area of stability (hashed circle). The lag means that the state in 2014 will lie along the lower blue line (exact position will depend on next year's area) and in 2015 will lie along the higher blue line.

Wednesday, September 25, 2013

The tipping point of 2008

As before, I have compiled this graph from official figures released by BLS and the US Fed.


Scatterplot of unemployment rate vs real interest rate (3-mo. treauries - inflation).

As some commentators have noted, the fall in unemployment rate is not supported by the fall in labor force participation, and it is likely that unemployment is understated because of the large number of individuals who have become discouraged.

In any event, we see a major change happened in late 2008, accompanied by a short-lived spike in real interest rate (mainly due to falling prices). Since then, interest rates have been slammed to real lows, but the unemployment rate has not significantly changed.

The transition from the lower area of concentration to the higher one is an example of a state change in a complex system. The system has switched from one mode of operation to another.

What are the two modes of operation? We can assume that one of them is an ideal economy in which most of the players are involved in some sort of productive enterprise. It is this economy which behaves more-or-less as predicted by economists--a drop in interest rates tends to cause a marginal increase in productive investment.

The trouble is that over the past couple of decades, an increasingly large proportion of economic activity was based on non-productive, or rent-seeking, activities--such as speculation, carry trades, and increased fees for normal financial activity. When the financial crisis hit in 2008, guess which sector received the majority of aid from central banking authorities. It wasn't the productive sector--it was the speculative sector. When you consistently reward an activity, you get more of it. At the same time, the productive sector suffered real damage, and contracted to the point where the US economy is now dominated by rent-seeking behaviour.

In an economy of speculation, lowering interest rates does nothing but reward further speculation (near bottom). If you can borrow ever-increasing amounts of money at near-zero interest, and make progressively larger bets on the global casino until it pays out, then why would you do something risky like build a factory to make refrigerators?

Since the lower interest rates aren't creating employment, the BLS has no choice but to keep removing discouraged workers from the list. It's the only way to reduce unemployment.

Well, keep pushing boys--eventually you'll get that unemployment "rate" down to 6% and you can claim mission accomplished--no matter what the real state of the economy.