
The Design Exchange has been hosting an exhibit on 3-d printing for a couple of weeks now. I decided to spin down to take a look at it before next month's meeting in Washington (which involves another 3-d printing process, but with metals).

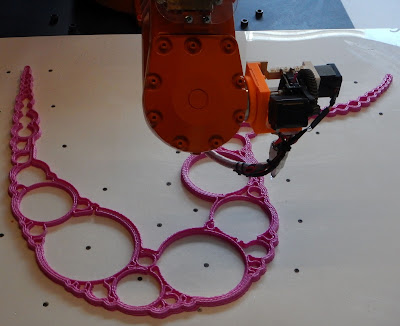
The first exhibit shows a machine tracing out it printed pattern in slow motion. The museum staff explained they didn't leave the machine printing because they didn't want to make thousands of chairs. But the arm followed the pink pattern without printing to demonstrate its ability to trace in minute detail. We were assured that the real printing proceeded much faster, but at full speed the machine arm represented a hazard to visitors.
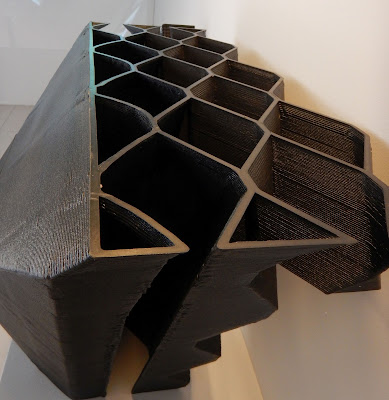
A section of wall for a four-story canal house being built in Amsterdam. The hollow spaces in the wall are to allow the wiring and plumbing to be installed after the house is assembled.
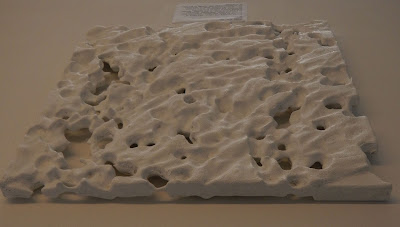

Examples of printed sandstone tiles. No scale, but they were a little bigger than a square foot.

Now a possible World Complex exclusive. Break out your 3D glasses (the cheap red and blue type).
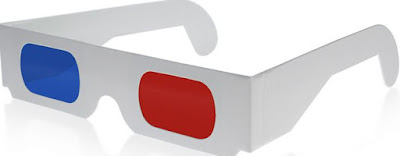
Take a look at the following. Your left eye should look through the red lens, your right eye through the blue.
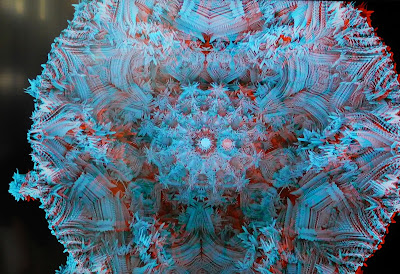
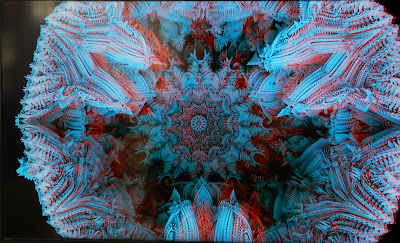

Images from video of the Arabesque wall. The top image seems to give the strongest effect.
I shot a little video, but it is too shaky to post. Need a tripod next time.


The first exhibit shows a machine tracing out it printed pattern in slow motion. The museum staff explained they didn't leave the machine printing because they didn't want to make thousands of chairs. But the arm followed the pink pattern without printing to demonstrate its ability to trace in minute detail. We were assured that the real printing proceeded much faster, but at full speed the machine arm represented a hazard to visitors.

A section of wall for a four-story canal house being built in Amsterdam. The hollow spaces in the wall are to allow the wiring and plumbing to be installed after the house is assembled.


Examples of printed sandstone tiles. No scale, but they were a little bigger than a square foot.

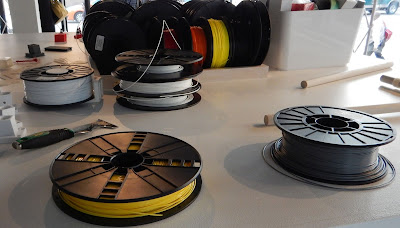
Spools of polymer used by the printers on-site.

A section of the arabesque wall.
Now a possible World Complex exclusive. Break out your 3D glasses (the cheap red and blue type).

Take a look at the following. Your left eye should look through the red lens, your right eye through the blue.


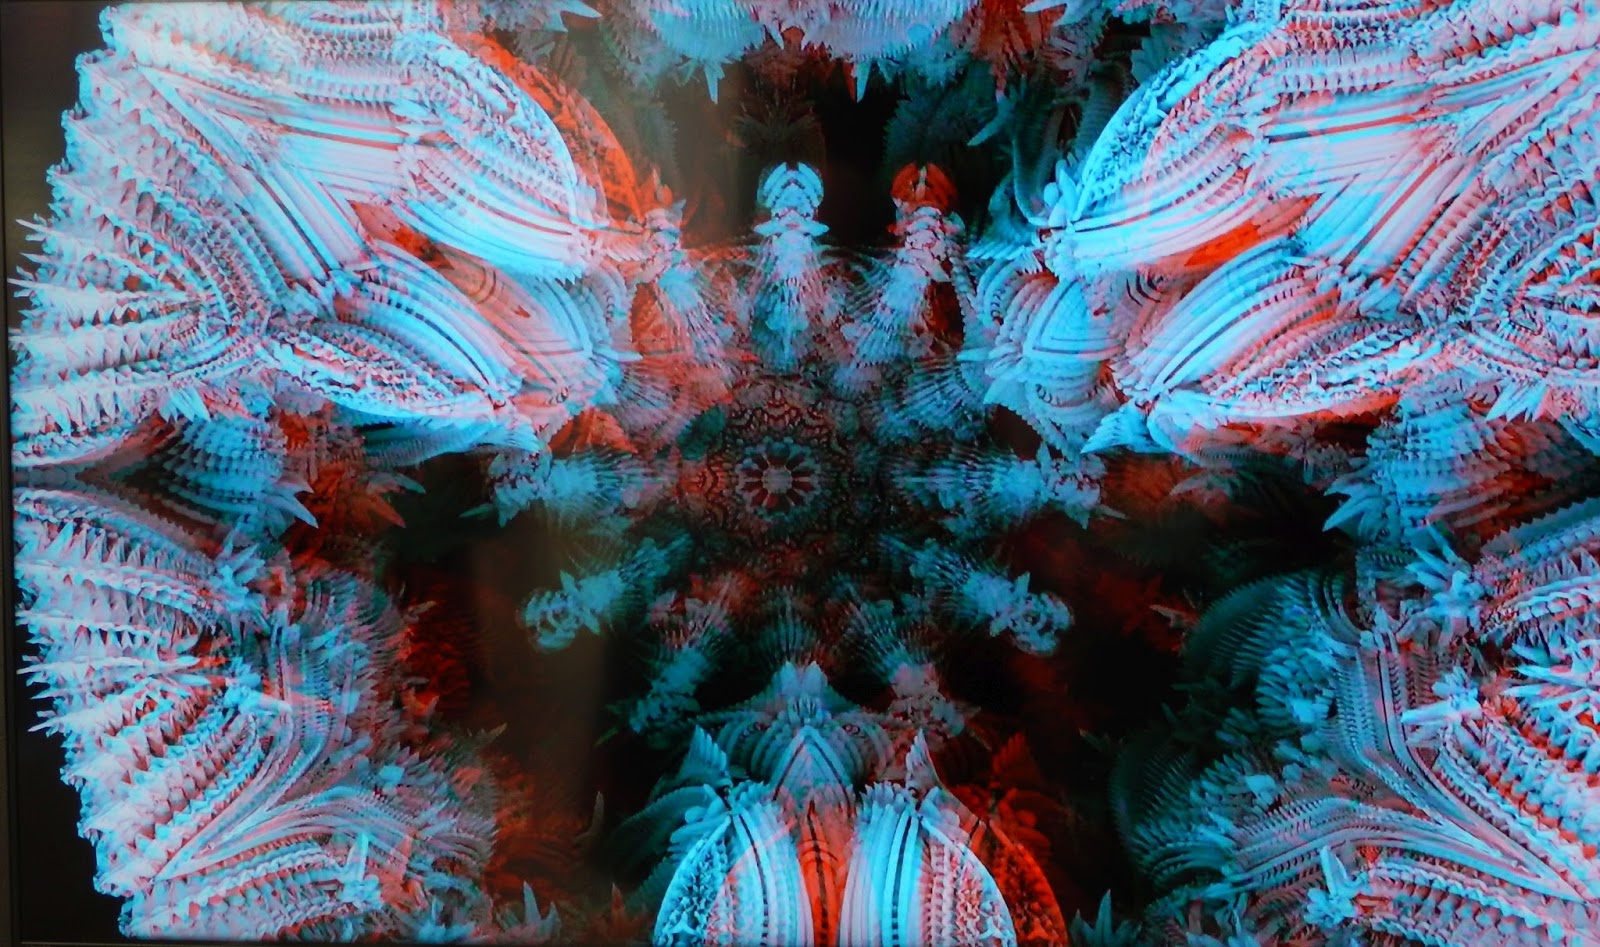
Images from video of the Arabesque wall. The top image seems to give the strongest effect.
I shot a little video, but it is too shaky to post. Need a tripod next time.


